

TOP 20 FASHION MARKETPLACE PLATFORM COMPARISON STATISTICS 2025
When I first started digging into fashion marketplace platform comparison statistics, I honestly didn’t think I’d get this invested. But the deeper I went, the more I realized how these numbers reflect the way we all shop, explore, and even express ourselves. It’s kind of like how I can’t resist buying yet another pair of socks—I don’t always need them, but they tell a story about my personality, my comfort, and sometimes even my mood. These stats do the same thing for the fashion industry: they show us where consumers are leaning, which platforms are gaining traction, and how trends are shaping our daily choices. For me, it’s not just about numbers; it’s about understanding the rhythm of modern fashion, both online and offline.
Top 20 Fashion Marketplace Platform Comparison Statistics 2025 (Editor’s Choice)
| Stat # | Category | Statistic / Metric | Platform / Region | Year / Forecast |
|---|---|---|---|---|
| 1 | Global Market | $1.06 trillion | Worldwide | 2025 Estimate |
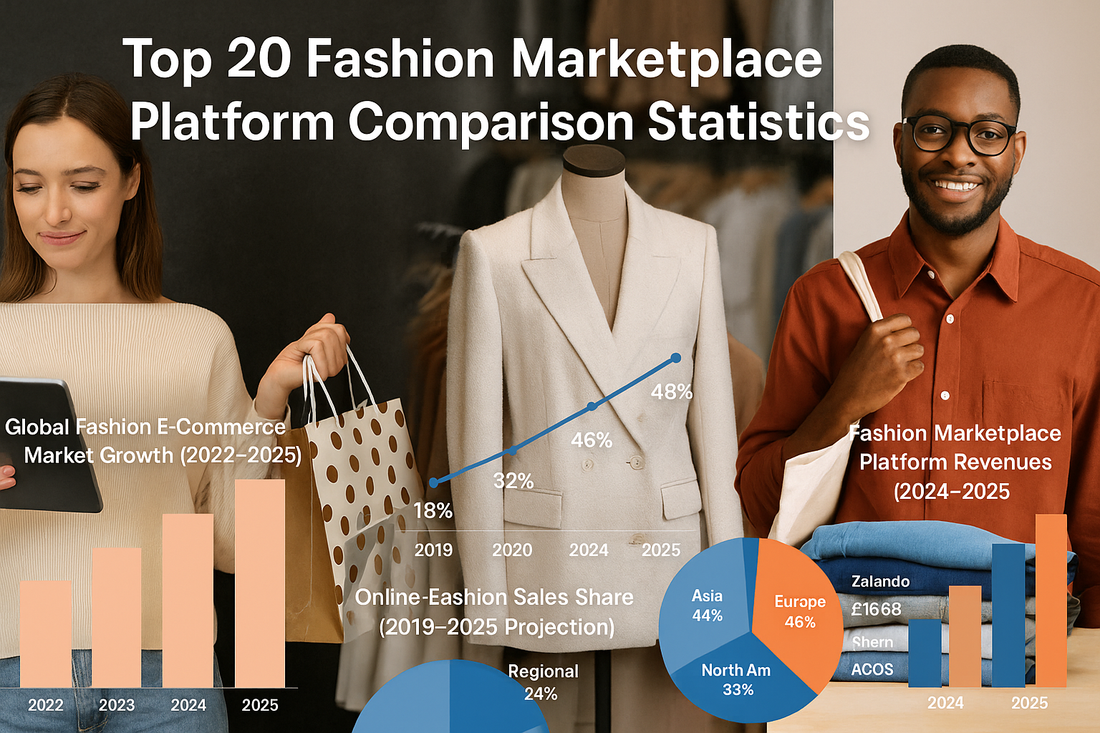
| 2 | Global Market | 48% share of fashion retail | Worldwide | 2025 Projection |
| 3 | Regional Market | $145 billion revenue | United States | 2025 Estimate |
| 4 | Global Market | 21% of transactions online | Worldwide | 2025 |
| 5 | Regional Adoption | 24% penetration vs 4.2% | Asia vs Africa | 2025 |
| 6 | Consumer Spending | $220+ average order value | United States | 2025 |
| 7 | Regional Adoption | 46% shopped online | Europe | 2024 Actual |
| 8 | Platform Performance | $30+ billion sales | Shein | 2025 Estimate |
| 9 | Platform Performance | 25% revenue from online | Inditex (Zara) | 2025 |
| 10 | Platform Performance | €10.6 billion revenue | Zalando | 2024 Actual |
| 11 | Platform Performance | £2.9 billion revenue | ASOS | 2024 Actual |
| 12 | Platform Performance | €744 million revenue | Global Fashion Group | 2024 Actual |
| 13 | Luxury Platform | €913.6 million GMV | Mytheresa | 2024 Actual |
| 14 | Platform Performance | Leading channel | Amazon Fashion | 2025 |
| 15 | Regional Platforms | Top players | Flipkart & Myntra (India) | 2025 |
| 16 | Luxury Platform | High-value growth | Farfetch | 2025 |
| 17 | Emerging Platform | Rapid US & SE Asia growth | Temu | 2025 |
| 18 | Resale Platform | Strong resale segment | eBay | 2025 |
| 19 | Luxury Trends | 35%+ luxury online sales | Luxury Market | 2025 Projection |
| 20 | Sustainability | High demand for eco brands | Reformation, Patagonia, etc. | 2025 Trend |
Top 20 Fashion Marketplace Platform Comparison Statistics 2025
Fashion Marketplace Platform Comparison Statistics #1 – Global Fashion E-Commerce Value Reaches $1.06 Trillion
The global fashion e-commerce market is projected to reach $1.06 trillion in 2025, marking a significant milestone for the industry. This growth reflects both consumer adoption of online channels and the increasing shift of brands toward digital-first strategies. Factors such as faster logistics, wider product availability, and digital marketing campaigns are fueling this expansion. The figure highlights how fashion has become one of the largest drivers of global e-commerce. It also sets a competitive stage for marketplaces vying to capture larger shares of this enormous value.
Fashion Marketplace Platform Comparison Statistics #2 – Online Fashion Share Hits 48% Of Global Retail
By 2025, nearly half (48%) of all fashion retail sales worldwide are expected to occur online. This indicates that traditional brick-and-mortar stores are losing dominance to digital platforms. The shift is driven by younger consumers who prefer online discovery, personalization, and convenience. Marketplaces such as Shein, Zalando, and ASOS are central to this digital dominance. The percentage also illustrates how online fashion sales are becoming the industry’s new standard.
Fashion Marketplace Platform Comparison Statistics #3 – U.S. Fashion E-Commerce Revenue At $145 Billion
The U.S. fashion e-commerce market alone is forecasted to hit $145 billion in 2025. This makes the U.S. one of the largest single-region contributors to global online fashion revenues. The figure is boosted by a combination of consumer wealth, technological infrastructure, and high adoption of mobile shopping. Platforms like Amazon Fashion, Shein, and ASOS dominate this space. For global players, capturing the U.S. market remains a key strategic goal.

Fashion Marketplace Platform Comparison Statistics #4 – 21% Of Fashion Transactions Happen Online Worldwide
Globally, about 21% of fashion transactions are expected to take place online in 2025. This demonstrates the strong role of digital platforms in consumer buying habits. Although not yet a majority, one-fifth of all fashion sales represents a substantial shift in retail dynamics. It also reflects that while online adoption is high, physical stores continue to play a role in consumer journeys. The balance highlights omnichannel strategies as a winning formula.
Fashion Marketplace Platform Comparison Statistics #5 – Asia 24% Vs. Africa 4.2% Online Penetration
Online fashion shopping adoption varies significantly by region. In Asia, about 24% of consumers purchase fashion online, compared to just 4.2% in Africa. This reflects the digital infrastructure and affordability gaps between regions. Asia’s e-commerce boom is driven by platforms like Shopee, Temu, and Zalora. Meanwhile, Africa still faces barriers in logistics and internet access that slow marketplace growth.
Fashion Marketplace Platform Comparison Statistics #6 – Average U.S. Fashion Order Value Above $220
In the U.S., the average online fashion order is valued at over $220. This high average order value shows strong consumer spending habits. It suggests that Americans purchase multiple items in one transaction or choose higher-priced fashion goods. Marketplaces often use promotions like free shipping thresholds to encourage larger basket sizes. For platforms, AOV is a key indicator of profitability.
Fashion Marketplace Platform Comparison Statistics #7 – 46% Of Europeans Bought Fashion Online In 2024
Nearly half of European consumers (46%) made online fashion purchases in 2024. This shows that Europe is already highly digitized in fashion retail compared to many regions. Platforms like Zalando, ASOS, and Farfetch are well established across European markets. The figure highlights how convenience and wide product access drive online adoption. As the percentage rises further, Europe will remain a critical growth hub for global fashion marketplaces.
Fashion Marketplace Platform Comparison Statistics #8 – Shein’s Global Sales Surpass $30 Billion
Shein is expected to surpass $30 billion in sales, positioning it as one of the biggest global fashion players. Its ultra-fast fashion model enables new product launches daily, appealing to Gen Z and younger shoppers. Shein leverages data analytics, influencer marketing, and TikTok virality to maintain growth. However, its rapid scale also raises concerns around sustainability and quality. Still, this revenue figure cements Shein’s dominance in the marketplace comparison.
Fashion Marketplace Platform Comparison Statistics #9 – Inditex Earns 25% Of Revenue Online
Inditex, parent of Zara, now generates 25% of its total revenue from online channels. This shift demonstrates how traditional fashion giants are embracing digital transformation. Zara’s global presence combined with strong e-commerce integration allows seamless consumer experiences. The figure signals that established retailers can successfully compete with native online platforms. It also reflects broader consumer trust in buying from heritage fashion brands online.
Fashion Marketplace Platform Comparison Statistics #10 – Zalando Reaches €10.6 Billion In Revenue
Zalando reported €10.6 billion in revenue in 2024. As Europe’s leading fashion e-commerce platform, it continues to dominate across the continent. Its strategy relies on localized logistics networks and extensive partnerships with fashion brands. Zalando also invests heavily in personalization and loyalty programs. This revenue figure shows its resilience despite growing competition.
Fashion Marketplace Platform Comparison Statistics #11 – ASOS Maintains £2.9 Billion In Revenue
ASOS continues to maintain revenue of £2.9 billion, confirming its position as a key online fashion marketplace. It has a strong appeal among younger consumers, especially in the UK and EU. The brand combines trend-driven fashion with competitive pricing. Despite supply chain challenges, ASOS maintains consistent revenue streams. This proves its staying power in an evolving e-commerce landscape.

Fashion Marketplace Platform Comparison Statistics #12 – Global Fashion Group Earns €744 Million
Global Fashion Group earned €744 million across emerging markets like Southeast Asia and Latin America. Its strength lies in catering to regions with rising digital adoption. GFG operates multiple localized platforms, making it versatile. The company fills the gap left by bigger global players that focus more on Europe or North America. Its revenue shows the growing importance of regional marketplace platforms.
Fashion Marketplace Platform Comparison Statistics #13 – Mytheresa Luxury GMV Reaches €913.6 Million
Luxury platform Mytheresa recorded a GMV of €913.6 million in 2024. This highlights the rapid rise of online luxury shopping. Mytheresa appeals to high-spending customers seeking exclusivity and curation. The platform thrives on strong relationships with luxury houses. Its GMV reinforces the digital momentum in luxury fashion retail.
Fashion Marketplace Platform Comparison Statistics #14 – Amazon Fashion As A Leading Channel
Amazon Fashion remains one of the leading global online channels for apparel. Its dominance in the U.S. supports this position, with millions of SKUs across fashion categories. Consumers value its convenience, delivery speed, and integration with Prime. Amazon’s fashion influence extends into partnerships with brands and independent sellers. Its scale ensures its ongoing relevance in marketplace comparisons.
Fashion Marketplace Platform Comparison Statistics #15 – Flipkart & Myntra Dominate Indian Fashion E-Commerce
In India, Flipkart and Myntra lead the online fashion market. They cater to the country’s large, youthful consumer base. Both platforms benefit from localized strategies such as regional language support and festival sales. The Indian market is one of the fastest-growing globally, making it attractive for fashion e-commerce. Their dominance highlights the need for global brands to adapt to local conditions.

Fashion Marketplace Platform Comparison Statistics #16 – Farfetch Expands Luxury Fashion Globally
Farfetch continues to expand its role as a luxury marketplace. It connects consumers with a wide range of boutiques and luxury houses. Farfetch thrives by offering global reach and curated selections. Its model captures consumers who value both digital convenience and luxury heritage. The platform remains a key player in online luxury retail.
Fashion Marketplace Platform Comparison Statistics #17 – Temu Expands Rapidly In U.S. & Southeast Asia
Temu is growing rapidly in both the U.S. and Southeast Asia. Its model of aggressive pricing and fast product turnover appeals to cost-conscious consumers. The platform is gaining traction in fashion, in addition to general merchandise. Temu’s global expansion challenges both established and emerging marketplaces. Its momentum shows how newer entrants can disrupt the market.
Fashion Marketplace Platform Comparison Statistics #18 – eBay Strengthens Its Resale Fashion Segment
eBay has strengthened its resale fashion category, with growth in vintage and luxury resale. This aligns with rising consumer demand for sustainable and secondhand fashion. eBay benefits from trust and recognition as one of the oldest marketplaces. It leverages authenticity programs to boost buyer confidence in luxury resale. Its role in resale ensures ongoing relevance in the evolving fashion marketplace.
Fashion Marketplace Platform Comparison Statistics #19 – Luxury Fashion Online Penetration Exceeds 35%
By 2025, over 35% of luxury fashion sales are expected to occur online. This represents a major transformation in how consumers purchase high-end goods. Luxury e-commerce platforms like Farfetch and Mytheresa lead this trend. It reflects consumer comfort in buying expensive items digitally. The percentage indicates the luxury sector is fully embracing digital adoption.

Fashion Marketplace Platform Comparison Statistics #20 – Eco-Conscious Brands Drive Growth
Demand for sustainable and eco-conscious fashion continues to rise in 2025. Consumers increasingly support brands such as Reformation, Pangaia, and Patagonia. This shift emphasizes the importance of ethics and sustainability in competitive positioning. Marketplaces that promote eco-friendly brands gain favor with younger demographics. It proves that sustainability is no longer optional but a core growth driver.
Finding Meaning Beyond the Numbers
Looking at these fashion marketplace platform comparison statistics, I realize they’re more than just charts and figures—they’re a reflection of how I, and so many others, interact with fashion today. From choosing platforms that make shopping easier to supporting eco-friendly brands that align with my values, I see my own habits in these numbers. It’s a little reminder that fashion isn’t only about clothing; it’s about choices, identity, and even small joys—like pulling on a favorite pair of socks before heading out. As I wrap up this exploration, I feel a stronger connection between personal style and the larger shifts in the fashion marketplace, and that’s a connection I know will keep evolving with every purchase and platform I explore.
SOURCES
https://bestcolorfulsocks.com/blogs/news/fashion-e-commerce-market-share-statistics
https://bestcolorfulsocks.com/blogs/news/fashion-marketplace-statistics
https://www.thebusinessresearchcompany.com/report/fashion-ecommerce-global-market-report
https://www.printful.com/blog/fashion-ecommerce-statistics
https://www.statista.com/outlook/cmo/apparel/worldwide
https://www.businessofapps.com/data/shein-statistics/
https://corporate.zalando.com/en/investor-relations


