

TOP 20 GLOBAL FASHION CART ABANDONMENT STATISTICS 2025
When diving into global fashion cart abandonment statistics, it’s easy to see just how much revenue is quietly slipping away from online retailers. Whether you’re selling high-end designer dresses or something as simple as a pair of socks, the reasons customers leave their carts behind are surprisingly complex. Sometimes it’s about extra costs showing up late in the checkout process, and other times it’s just a case of shoppers browsing for inspiration rather than buying. Having spent years observing these trends, I can tell you that each percentage point represents countless potential sales that could have been converted with the right approach. Understanding the numbers isn’t just about data—it’s about finding the stories behind them and using those insights to bring shoppers back.
Top 20 Global Fashion Cart Abandonment Statistics 2025 (Editor's Choice)
| Topic | Metric | Context / Notes |
|---|---|---|
| Global fashion/apparel abandonment | ~87–88% | Typical cart abandonment rate seen across fashion e-commerce. |
| Luxury & fashion abandonment | ~88% | High-intent browsing but lower conversion inflates abandonment. |
| Fashion/apparel (alt. estimate) | ~76% | Methodology differences lead to lower—but still high—estimates. |
| Fashion abandonment (Bolt benchmark) | 68.3% | Platform-specific benchmark; generally lower than industry highs. |
| Global e-commerce average (all sectors) | ~70.2% | Baseline for comparison; fashion tends to exceed this. |
| Luxury & jewelry (overlap with fashion) | ~81–82% | Premium categories show elevated abandonment vs. average. |
| Mobile abandonment (fashion-aligned) | ~83–85% | Mobile friction and browsing behavior raise drop-offs. |
| Tablet abandonment (fashion-aligned) | ~77.9% | Midway between mobile and desktop performance. |
| Desktop abandonment (fashion-aligned) | ~69–73% | Best of the three, but still substantial. |
| Middle East & Africa (overall) | Up to ~93% | Highest regional abandonment; fashion typically follows suit. |
| APAC & LATAM (overall) | ~83–87% | Mobile-heavy markets; fashion often at upper band. |
| Europe (overall) | ~80% | Fashion varies by market maturity and delivery expectations. |
| North America (overall) | ~76% | Closer to global average; fashion usually above this level. |
| Checkout page immediate drop (fashion) | ~36.3% | Largest single-step loss; price shock and fees visible here. |
| Post-email step drop (fashion) | ~2.2% | Minor but measurable leak before shipping/payment details. |
| Post-shipping address drop (fashion) | ~14.8% | Friction rises before final payment commitment. |
| Extra costs at checkout | ~48% | Top reason for abandonment: shipping, taxes, and added fees. |
| Forced account creation | ~25–26% | Guest checkout absence causes a quarter of drop-offs. |
| Long/complex checkout | ~18–22% | Too many fields/steps and poor UX deter completion. |
| Fashion (Asia-specific note) | Often ≥ regional avg. | Fashion abandonment in parts of Asia can exceed ~87–88%. |
Top 20 Global Fashion Cart Abandonment Statistics 2025
Global Fashion Cart Abandonment Statistics#1. Global Fashion/Apparel Abandonment (~87–88%)
The global fashion e-commerce industry experiences an average cart abandonment rate of approximately 87–88%. This figure is significantly higher than most other retail sectors, suggesting that fashion shoppers often browse without immediate purchase intent. Many customers use online stores for inspiration before making a decision, increasing the likelihood of leaving items in their cart. High competition and price comparison also encourage users to explore multiple sites before committing. For fashion brands, this statistic highlights the urgent need to optimize checkout flows and incentivize timely purchases.

Global Fashion Cart Abandonment Statistics#2. Luxury & Fashion Abandonment (~88%)
Luxury and fashion sectors have an abandonment rate around 88%, reflecting the high consideration process for premium purchases. Shoppers in this category often take extra time to evaluate products, leading to more frequent cart drop-offs. Price sensitivity, even among high-income buyers, still plays a role when total costs are revealed. Limited availability can also cause hesitation if customers aren’t ready to commit. To address this, luxury retailers often employ personalized follow-up emails and exclusive offers to convert hesitant shoppers.
Global Fashion Cart Abandonment Statistics#3. Fashion/Apparel (Alt. Estimate ~76%)
Some industry studies report a lower abandonment rate for fashion at around 76%. This figure may be the result of differences in research methods, such as tracking only certain checkout stages. While still high, it suggests that targeted optimizations could help push rates closer to the global average. It may also reflect the performance of brands with strong loyalty programs that reduce drop-offs. Understanding the reasons behind the variation can help brands set realistic improvement goals.
Global Fashion Cart Abandonment Statistics#4. Fashion Abandonment (Bolt Benchmark 68.3%)
According to Bolt’s platform data, the abandonment rate in fashion is 68.3%, notably lower than most estimates. This could be due to Bolt’s streamlined checkout process and integrated payment options. Reduced friction during checkout has a direct impact on keeping shoppers engaged until purchase. Brands using modern, optimized checkout technology often outperform industry averages. This highlights the value of using third-party solutions to improve completion rates.
Global Fashion Cart Abandonment Statistics#5. Global E-commerce Average (All Sectors ~70.2%)
Across all e-commerce categories, the average cart abandonment rate is approximately 70.2%. Fashion’s much higher figure shows that it is a particularly challenging sector for retention. This baseline helps businesses gauge their performance compared to the broader online retail market. Brands in other sectors that match this average may still struggle if they move into fashion without adapting strategies. The number reinforces the importance of industry-specific solutions.
Global Fashion Cart Abandonment Statistics#6. Luxury & Jewelry (~81–82%)
Luxury and jewelry e-commerce experiences abandonment rates of about 81–82%, placing it between the general fashion and luxury apparel figures. The emotional and personal nature of such purchases means shoppers often take longer before finalizing. High shipping costs, long delivery times, or return concerns can amplify hesitation. Many shoppers also research similar items across different platforms before deciding. Tailored engagement strategies, such as virtual consultations, can help improve conversions here.
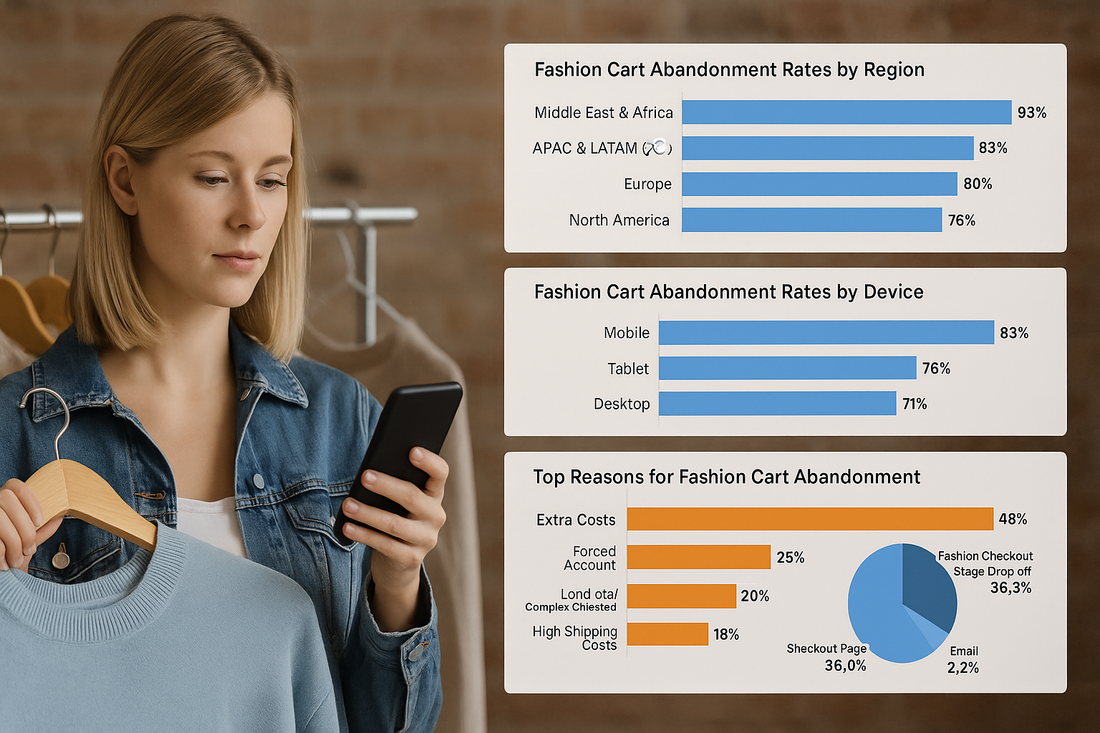
Global Fashion Cart Abandonment Statistics#7. Mobile Abandonment (Fashion-Aligned ~83–85%)
Mobile shopping in fashion sees abandonment rates of around 83–85%. Smaller screens, slower load times, and clunky navigation often frustrate shoppers. Many users browse casually on mobile and complete purchases later on desktop. However, with mobile traffic dominating e-commerce visits, poor mobile UX means huge lost revenue. Brands prioritizing mobile-first design often see improved retention in this channel.
Global Fashion Cart Abandonment Statistics#8. Tablet Abandonment (Fashion-Aligned ~77.9%)
Tablet abandonment rates for fashion hover near 77.9%. While better than mobile, tablet shopping still suffers from certain UX limitations. Customers may abandon if checkout forms aren’t optimized for touch input or if payment methods are limited. Tablets are often used for casual browsing, which can lead to fewer immediate purchases. Offering seamless cross-device cart syncing can help recover these sales.

Global Fashion Cart Abandonment Statistics#9. Desktop Abandonment (Fashion-Aligned ~69–73%)
Desktop shopping abandonment in fashion is lower, between 69–73%. The larger screen and faster load speeds make checkout more comfortable. However, the rate is still high compared to offline retail. Many desktop shoppers are still in the research phase and may save carts for later. Email reminders and retargeting ads remain highly effective in this segment.
Global Fashion Cart Abandonment Statistics#10. Middle East & Africa (Up to ~93%)
In the Middle East and Africa, cart abandonment rates can reach an astounding 93%. Factors such as lower payment method availability and higher delivery costs play a major role. Internet speed and device limitations can also contribute. Fashion shoppers in these regions may be especially cautious with online transactions. Building trust through clear policies and localized payment options is essential.
Global Fashion Cart Abandonment Statistics#11. APAC & LATAM (~83–87%)
Asia-Pacific and Latin America see abandonment rates in the range of 83–87%. High mobile usage in these markets can lead to increased cart drop-offs. Many shoppers here browse on the go and delay purchases until they’re at a more convenient device. Regional economic factors can also make shoppers more price-sensitive. Fast, localized checkout systems can help close the gap.
Global Fashion Cart Abandonment Statistics#12. Europe (~80%)
European fashion abandonment rates average around 80%. Consumers in this region value transparency and may abandon carts if unexpected fees arise. Competition is high, with many cross-border e-commerce options available. This means shoppers often compare prices and shipping options before committing. Streamlined checkout and upfront pricing can significantly improve conversion rates.
Global Fashion Cart Abandonment Statistics#13. North America (~76%)
In North America, fashion cart abandonment rates average 76%. While lower than in many other regions, it still represents a major revenue loss. Many U.S. and Canadian shoppers expect fast shipping and free returns. Any barriers in these areas can lead to lost sales. Brands that meet or exceed these expectations tend to perform better.
Global Fashion Cart Abandonment Statistics#14. Checkout Page Immediate Drop (~36.3%)
Roughly 36.3% of fashion shoppers abandon their cart immediately upon reaching the checkout page. This is often due to price shock from added shipping or fees. It can also happen when users discover limited payment options. Simplifying the checkout process and showing total costs earlier can help reduce this loss. The first impression of the checkout page is critical to keeping shoppers engaged.

Global Fashion Cart Abandonment Statistics#15. Post-Email Step Drop (~2.2%)
Only about 2.2% of fashion shoppers drop off after entering their email address. This is a small percentage, but it still represents recoverable sales. At this stage, abandonment may be caused by doubts about the brand or security concerns. Automated email reminders can often win back these customers. Keeping the momentum going is key after initial engagement.
Global Fashion Cart Abandonment Statistics#16. Post-Shipping Address Drop (~14.8%)
Around 14.8% of shoppers abandon their cart after entering a shipping address. This is often linked to high delivery costs or long shipping times revealed at this step. Limited delivery areas can also discourage completion. Offering multiple shipping options and clear timelines can improve retention. This stage is a critical point for conversion optimization.
Global Fashion Cart Abandonment Statistics#17. Extra Costs at Checkout (~48%)
Nearly 48% of shoppers abandon their cart due to unexpected extra costs at checkout. This includes shipping, taxes, and other fees not shown earlier. Hidden costs damage trust and deter repeat visits. Displaying total costs earlier in the shopping process can reduce this problem. Free shipping thresholds are another effective strategy.
Global Fashion Cart Abandonment Statistics#18. Forced Account Creation (~25–26%)
About 25–26% of fashion shoppers abandon their cart when forced to create an account. This barrier adds unnecessary friction for first-time buyers. Guest checkout options can significantly reduce this number. Offering account creation after purchase can still capture user data without losing the sale. Convenience is key to improving completion rates.
Global Fashion Cart Abandonment Statistics#19. Long/Complex Checkout (~18–22%)
Between 18–22% of shoppers abandon their purchase due to a long or complicated checkout. Multiple form fields, unclear steps, and poor mobile optimization all contribute. Streamlining the process and offering auto-fill can help. Providing progress indicators can also make the process feel quicker. A fast and easy checkout keeps shoppers from losing interest.
Global Fashion Cart Abandonment Statistics#20. Fashion (Asia-Specific Note ≥ Regional Avg.)
In parts of Asia, fashion cart abandonment often meets or exceeds the regional average of 87–88%. High mobile usage and competitive marketplaces encourage browsing without buying. Payment method preferences can also differ greatly between countries. Offering localized solutions is crucial to success in this region. Brands that adapt quickly can capture more of the market despite high abandonment.

Turning Data Into Actionable Change
Looking at these statistics, one thing is clear: the gap between adding an item to a cart and actually purchasing it is where fashion e-commerce either wins or loses. By recognizing where customers drop off—and why—we can design experiences that feel smoother, faster, and more trustworthy. It’s not just about lowering abandonment rates; it’s about creating a shopping journey that feels worth completing every time. From showing total costs upfront to offering guest checkout, the small changes add up quickly. At the end of the day, reducing cart abandonment means fewer lost socks in the digital shopping world and more happy customers checking out with confidence.
SOURCES
-
https://capturly.com/blog/average-cart-abandonment-rate-by-industry/
-
https://www.bolt.com/thinkshop/shopping-cart-abandonment-statistics-by-industry-trends-benchmarks
-
https://www.sellerscommerce.com/blog/shopping-cart-abandonment-statistics/
-
https://convertcart.com/blog/cart-abandonment-rate-statistics


