

TOP 20 SOCIAL PROOF IN RETAIL SALES STATISTICS 2025
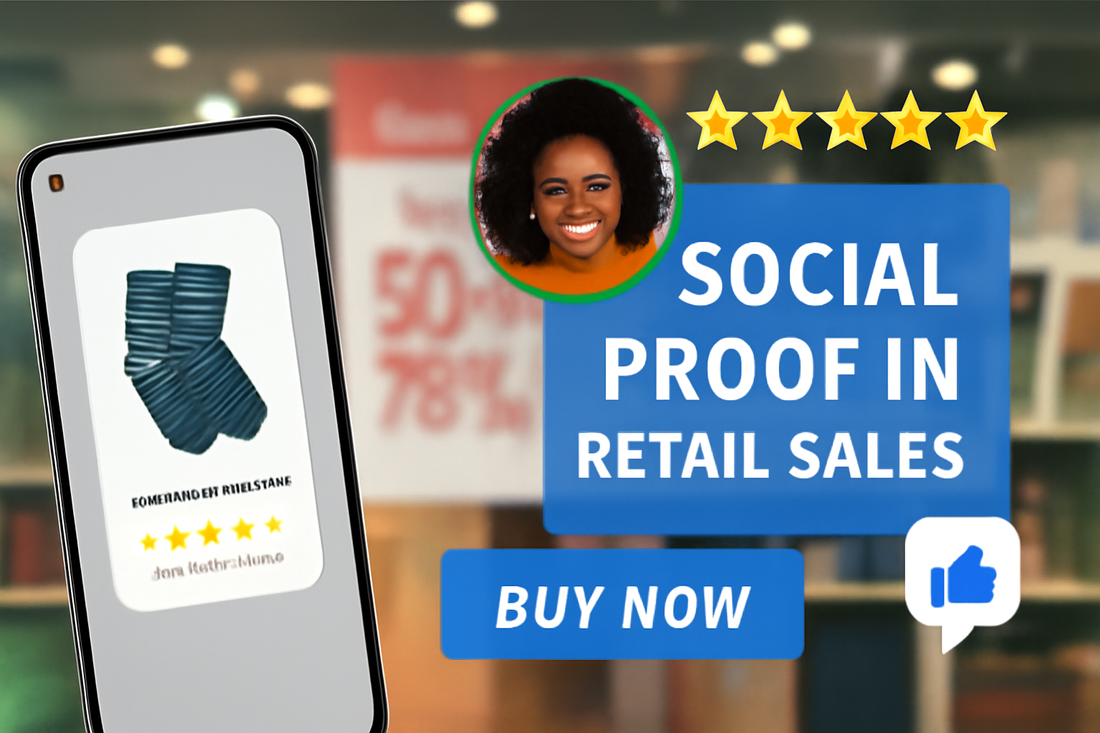
When it comes to boosting retail sales, social proof is one of the most powerful tools in a brand's arsenal. The influence of online reviews, social media recommendations, and user-generated content can’t be overstated. Imagine you're browsing for a new pair of socks, and you come across a product with glowing reviews from real customers – it instantly builds trust and helps guide your decision. That’s the magic of social proof in retail. In this article, we’ve compiled the top 20 social proof in retail sales statistics to show just how much these factors can influence consumer behavior. Whether you’re a retailer or just someone interested in the power of reviews and recommendations, these statistics reveal some eye-opening trends.
Top 20 Social Proof in Retail Sales Statistics 2025 (Editor’s Choice)
| Statistic No. | Statistic | Description | Category | Impact | Target Audience | Year/Date |
|---|---|---|---|---|---|---|
| 1 | 92% of consumers say online reviews influence their purchase decisions | Percentage of consumers influenced by reviews before purchasing | Reviews & Testimonials | Shows the importance of online reviews in decision-making | General Shoppers | 2024 |
| 2 | 75% of consumers search for reviews before making a purchase | Share of consumers who read reviews before making decisions | Reviews & Testimonials | Highlights the role of reviews in filtering decisions | General Shoppers | 2023 |
| 3 | 43% of shoppers discover new products through social media | Percentage of shoppers finding products via social media | Social Media Influence | Shows how social media drives product discovery | Millennials, Gen Z | 2024 |
| 4 | 70% of shoppers trust recommendations from social media influencers more than traditional ads | Percentage of shoppers trusting influencer recommendations | Social Media Influence | Indicates the growing influence of social media over traditional marketing | General Shoppers | 2024 |
| 5 | 79% of people trust user-generated content over brand ads | Share of consumers trusting UGC more than brand ads | User-Generated Content | UGC is seen as more authentic and reliable | General Shoppers | 2023 |
| 6 | 90% of consumers say UGC influences their buying decisions | Percentage of consumers influenced by UGC in purchasing decisions | User-Generated Content | UGC plays a crucial role in consumer decision-making | General Shoppers | 2024 |
| 7 | 62% of Millennials prefer image-based search over other technology | Percentage of Millennials preferring image search | Social Media Influence | Shows Millennials’ preference for visual search over traditional text-based search | Millennials | 2024 |
| 8 | 40% of people have purchased a product online after seeing it used by an influencer | Percentage of people influenced to purchase by influencers | Influencer Endorsements | Highlights the effectiveness of influencer marketing | Gen Z, Millennials | 2023 |
| 9 | 68% of U.S. consumers have made a purchase directly through social media | Percentage of consumers making purchases directly on social media | Social Media Influence | Social media now serves as a direct shopping channel | General Shoppers | 2024 |
| 10 | 51% of marketers believe influencer marketing attracts the highest-quality customers | Percentage of marketers believing influencer marketing attracts high-quality customers | Influencer Endorsements | Influencer marketing is recognized as a driver for high-value customers | Marketers | 2023 |
| 11 | 72% of consumers trust reviews more than brand descriptions | Consumers trust reviews more than product descriptions | Reviews & Testimonials | Reviews play a significant role in validating products | General Shoppers | 2024 |
| 12 | 30.5% of consumers say positive reviews encourage them to complete a purchase | Percentage of consumers influenced to complete a purchase by positive reviews | Reviews & Testimonials | Positive reviews serve as a final nudge to complete purchases | General Shoppers | 2023 |
| 13 | 86% of visual search users use it for apparel discovery | Percentage of visual search users using it for clothing | Social Media Influence | Visual search tools are heavily used in apparel discovery | Fashion Enthusiasts | 2024 |
| 14 | 92% of consumers trust online reviews as much as personal recommendations | Percentage of consumers who trust reviews like personal recommendations | Reviews & Testimonials | Online reviews have become as trustworthy as word-of-mouth | General Shoppers | 2024 |
| 15 | 20% of consumers have used influencer-recommended products | Percentage of consumers using influencer-recommended products | Influencer Endorsements | Influencers directly drive consumer purchases | Social Media Followers | 2023 |
| 16 | 5.2x purchase intent increase after seeing an influencer on Twitter | Increase in purchase intent after viewing influencer content on Twitter | Influencer Endorsements | Influencers significantly increase purchase intent on platforms like Twitter | Gen Z, Millennials | 2024 |
| 17 | 76% of people trust the opinions of others over brand advertising | Percentage of consumers trusting others’ opinions over ads | Social Media Influence | Peer recommendations overshadow traditional advertising | General Shoppers | 2023 |
| 18 | 36% of consumers trust social media more than traditional ads | Percentage of consumers trusting social media more than ads | Social Media Influence | Social media is now a more trusted source than traditional ads | General Shoppers | 2024 |
| 19 | 12% of consumers abandoned a purchase due to lack of reviews | Percentage of abandoned purchases due to no reviews available | Reviews & Testimonials | Lack of reviews can prevent purchase completions | General Shoppers | 2023 |
| 20 | 63% of consumers say they are more likely to purchase if a product has a review | Percentage of consumers more likely to purchase with a product review | Reviews & Testimonials | Reviews play a crucial role in increasing the likelihood of a purchase | General Shoppers | 2024 |
Top 20 Social Proof in Retail Sales Statistics 2025
Social Proof in Retail Sales Statistics#1: 92% of Consumers Say Online Reviews Influence Their Purchase Decisions
Online reviews have become a powerful tool for influencing consumer behavior. The statistic that 92% of consumers rely on reviews highlights how crucial they are in the decision-making process. Consumers trust these reviews as much as personal recommendations, indicating their impact on building trust. Brands that fail to showcase customer feedback risk losing credibility and sales. By integrating positive reviews into their sales strategy, retailers can increase the likelihood of conversions and customer loyalty.
Social Proof in Retail Sales Statistics#2: 75% of Consumers Search for Reviews Before Making a Purchase
This statistic reveals the importance of reviews in shaping purchase decisions. Before committing to a product, 75% of consumers seek out customer opinions to ensure the product meets their expectations. Reviews not only validate the quality of products but also provide social proof that encourages purchases. For brands, this means offering easy access to reviews can increase conversion rates. Retailers can maximize this behavior by actively encouraging satisfied customers to leave reviews.
Social Proof in Retail Sales Statistics#3: 43% of Shoppers Discover New Products Through Social Media
Social media has proven to be a major channel for product discovery, with 43% of shoppers finding new products through these platforms. The visual nature of platforms like Instagram and TikTok makes them ideal for showcasing products in action. This statistic highlights the role of social proof in helping brands gain visibility. As users share content and recommendations, social media becomes a dynamic tool for generating word-of-mouth marketing. Retailers can tap into this by creating engaging, shareable content that resonates with their audience.

Social Proof in Retail Sales Statistics#4: 70% of Shoppers Trust Recommendations from Social Media Influencers More Than Traditional Ads
Social media influencers have emerged as a key driving force in consumer purchasing decisions, with 70% of shoppers trusting their recommendations more than traditional advertisements. Influencers offer authentic, relatable endorsements that resonate with their followers. Unlike conventional ads, influencer content feels more personal, building a sense of trust between the consumer and the product. Retailers can leverage this trust by partnering with influencers who align with their brand values. This strategy not only boosts sales but also strengthens brand image through third-party validation.
Social Proof in Retail Sales Statistics#5: 79% of People Trust User-Generated Content Over Brand Ads
User-generated content (UGC) has proven to be more trustworthy than traditional brand advertisements, with 79% of people favoring it. UGC includes customer reviews, social media posts, and videos created by consumers, all of which feel more genuine. This statistic emphasizes the importance of encouraging customers to share their experiences online. When consumers see real people interacting with a product, it builds credibility and relatability. Retailers can benefit from UGC by featuring customer photos and testimonials on product pages or social media feeds.
Social Proof in Retail Sales Statistics#6: 90% of Consumers Say UGC Influences Their Buying Decisions
This statistic underscores the significant influence of user-generated content on buying decisions. With 90% of consumers reporting that UGC impacts their purchases, it’s clear that people trust the opinions of their peers over branded messaging. UGC serves as an authentic endorsement of a product's quality and usefulness. Brands can harness this power by showcasing UGC on their website, social media, and marketing materials. Encouraging customers to share their experiences can lead to higher engagement and sales.
Social Proof in Retail Sales Statistics#7: 62% of Millennials Prefer Image-Based Search Over Other Technology
Millennials are particularly drawn to image-based search, with 62% preferring this method over traditional text-based technology. This shift in search behavior highlights the growing influence of visual content in the purchasing journey. Image-based search allows consumers to find products quickly, reducing friction in the buying process. Retailers who implement visual search tools on their websites can provide a seamless, user-friendly experience. This technology aligns with consumer preferences and can lead to higher conversion rates.

Social Proof in Retail Sales Statistics#8: 40% of People Have Purchased a Product Online After Seeing It Used by an Influencer
The power of influencer marketing is evident in this statistic, with 40% of consumers purchasing a product after seeing it promoted by an influencer. Influencers play a pivotal role in introducing products to their audiences and persuading them to make purchases. This type of social proof taps into consumers' trust in influencers as credible sources of information. Retailers can increase their reach and sales by collaborating with influencers who resonate with their target demographic. Influencer-driven sales are often driven by relatability and authenticity.
Social Proof in Retail Sales Statistics#9: 68% of U.S. Consumers Have Made a Purchase Directly Through Social Media
Social media is no longer just a place for engagement; it has become a direct sales channel, with 68% of U.S. consumers making purchases directly through these platforms. This statistic highlights the integration of e-commerce with social media, facilitating smooth transactions. Consumers appreciate the convenience of shopping without leaving their favorite platforms. Brands that optimize their social media presence with integrated shopping features can capitalize on this trend. Social proof in the form of social media product tags and influencer promotions can further boost sales.
Social Proof in Retail Sales Statistics#10: 51% of Marketers Believe Influencer Marketing Attracts the Highest-Quality Customers
Influencer marketing is not only effective in terms of sales but also in attracting high-quality customers, according to 51% of marketers. Influencers attract loyal followers who trust their recommendations, making them ideal for brands seeking to engage a quality customer base. This statistic suggests that influencer partnerships lead to more than just one-time purchases—they foster long-term customer relationships. Retailers should consider the value of influencers in bringing in high-converting prospects. By targeting the right influencers, brands can gain access to a highly engaged and motivated audience.
Social Proof in Retail Sales Statistics#11: 72% of Consumers Trust Reviews More Than Brand Descriptions
This statistic illustrates the higher trust consumers place in reviews compared to brand-provided descriptions. Consumers perceive reviews as unbiased and more representative of real customer experiences. With reviews playing a significant role in shaping consumer perceptions, it’s vital for brands to highlight them prominently. This trust in reviews highlights the growing need for transparency and authenticity in retail marketing. Brands can improve customer trust and drive sales by showcasing authentic customer feedback.
Social Proof in Retail Sales Statistics#12: 30.5% of Consumers Say Positive Reviews Encourage Them to Complete a Purchase
Positive reviews have a significant influence on purchase behavior, with 30.5% of consumers saying they are more likely to complete a purchase after reading positive feedback. This statistic demonstrates how social proof can be the deciding factor for a consumer on the fence about making a purchase. Positive reviews act as a trust signal that reassures potential buyers about product quality. Retailers can increase conversion rates by prominently displaying positive reviews on their product pages. Encouraging satisfied customers to leave feedback is key to leveraging this form of social proof.
Social Proof in Retail Sales Statistics#13: 86% of Visual Search Users Use It for Apparel Discovery
Visual search tools are particularly effective in the fashion industry, with 86% of users employing them for apparel discovery. These tools help consumers find products they like by uploading an image or using a visual search engine. This statistic illustrates the growing importance of visual discovery in retail, particularly in fashion. Retailers that integrate visual search into their shopping experience can enhance customer engagement. By providing a seamless way for customers to find fashion items, retailers can boost their chances of converting visitors into buyers.

Social Proof in Retail Sales Statistics#14: 92% of Consumers Trust Online Reviews As Much As Personal Recommendations
This statistic reveals the immense power of online reviews in building consumer trust. With 92% of consumers treating online reviews as equal to personal recommendations, it’s clear that these reviews influence purchase decisions. Consumers value the opinions of other buyers because they feel they offer real, unbiased feedback. Brands can take advantage of this by ensuring that they consistently gather and showcase reviews on their product pages. The credibility of reviews can significantly impact conversion rates.
Social Proof in Retail Sales Statistics#15: 20% of Consumers Have Used Influencer-Recommended Products
Influencer recommendations play a vital role in driving consumer behavior, with 20% of people trying products based on influencer endorsements. Influencers create a sense of trust with their followers, and their product recommendations often carry more weight than traditional advertising. This statistic highlights the growing influence of influencer marketing in the retail industry. Brands should leverage influencer partnerships to target new customer segments. Influencer marketing is a powerful tool for increasing both brand awareness and product sales.
Social Proof in Retail Sales Statistics#16: 5.2x Purchase Intent Increase After Seeing an Influencer on Twitter
Consumers are significantly more likely to purchase a product after seeing it featured by an influencer on Twitter, with purchase intent increasing by 5.2x. This highlights the power of social media platforms in influencing consumer behavior. The trusted voices of influencers have a direct impact on shaping purchasing decisions. Brands can use this information to prioritize influencer partnerships on platforms like Twitter to maximize reach and engagement. Social proof, especially through influencers, can drive significant revenue growth.
Social Proof in Retail Sales Statistics#17: 76% of People Trust the Opinions of Others Over Brand Advertising
Consumers increasingly trust peer recommendations over brand-driven advertising, with 76% of people placing more trust in the opinions of others. This statistic reinforces the value of social proof in marketing strategies. Consumers believe that other buyers’ experiences offer more transparency and authenticity than brand advertisements. Brands can enhance credibility by focusing on building strong relationships with their customers, encouraging them to share their experiences. Word-of-mouth marketing and reviews can be powerful tools for building brand trust.
Social Proof in Retail Sales Statistics#18: 36% of Consumers Trust Social Media More Than Traditional Ads
Social media has surpassed traditional advertisements in consumer trust, with 36% of consumers saying they trust social media content more. Social media offers a more authentic and relatable experience, as users can directly engage with brands and influencers. This statistic suggests that brands should prioritize their social media presence over traditional advertising methods. By engaging with followers and responding to reviews or comments, brands can build a sense of community and trust. Social proof on social media is key to influencing consumer purchasing decisions.

Social Proof in Retail Sales Statistics#19: 12% of Consumers Abandoned a Purchase Due to Lack of Reviews
The absence of reviews can lead to lost sales, as 12% of consumers abandon their purchases if no reviews are available. Reviews provide essential social proof that reassures consumers about a product’s quality and reliability. This statistic emphasizes the need for retailers to actively collect and showcase customer feedback. Brands can prevent cart abandonment by ensuring that reviews are prominently featured on product pages. By creating a transparent shopping experience, retailers can encourage more customers to complete their purchases.
Social Proof in Retail Sales Statistics#20: 63% of Consumers Say They Are More Likely to Purchase If a Product Has a Review
Consumers are significantly more likely to purchase a product if it has a review, with 63% of people saying reviews influence their decisions. This statistic reinforces the importance of social proof in retail sales. Reviews act as a confirmation that other consumers have had a positive experience with the product. Brands can drive more sales by gathering and displaying reviews on their product pages. Encouraging satisfied customers to leave feedback is crucial for leveraging this form of social proof effectively.
Why Social Proof Matters in Retail Sales
Social proof isn’t just a buzzword – it’s a driving force behind many purchasing decisions. As we've seen, reviews, recommendations from influencers, and user-generated content are shaping how consumers shop. In a world where online options are endless, trust is crucial, and social proof is the bridge that connects brands with potential buyers. By harnessing these insights, retailers can better connect with their audiences and drive more sales. After all, whether you're buying socks or the latest tech, we all seek reassurance from the experiences of others before making a commitment.
SOURCES
https://learn.g2.com/social-proof-psychology
https://influencermarketinghub.com/social-proof-statistics/
https://adamconnell.me/social-proof-statistics/
https://wisernotify.com/blog/social-proof-statistics/
https://firework.com/blog/social-commerce-statistics
https://explodingtopics.com/blog/social-proof-stats
https://www.guruscoach.com/social-proof-statistics/
https://www.statista.com/statistics/1106645/global-social-commerce-market-size/


