

TOP 20 VIRTUAL MODEL CONVERSION LIFT STATISTICS 2025
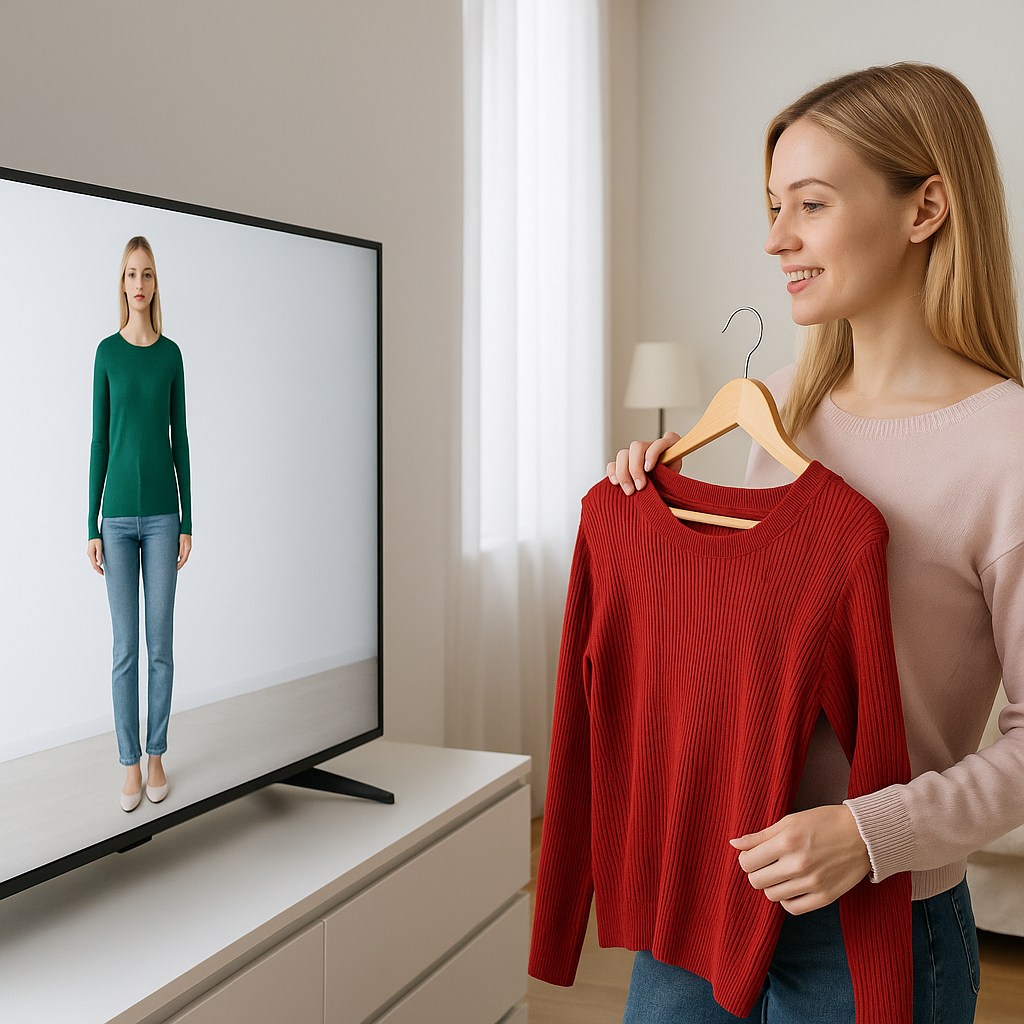
Shopping online has changed a lot in the past few years, and not just in the way we scroll through endless product pages while wearing our comfiest socks. Today, customers expect more than flat images — they want to see how clothes will actually look and fit before clicking “buy.” That’s where virtual try-on technology steps in, giving shoppers the confidence they need to make a purchase. In this post, we’re diving into some of the most eye-opening virtual model conversion lift statistics, showing just how much of an impact this tech can have on sales, returns, and customer satisfaction. Whether you’re a brand looking to reduce returns or a curious shopper wondering why your favorite store feels more interactive than ever, these insights will give you the bigger picture.
Top 20 Virtual Model Conversion Lift Statistics 2025 (Editor's Choice)
| # | Statistic | Impact |
|---|---|---|
| 1 | 34% uplift in conversion rates from virtual fitting room usage | +34% conversions, -60% returns |
| 2 | 25% increase in conversion rates with AR try-on | +25% conversions, -40% returns |
| 3 | 30% sales growth after 6 months of virtual try-on integration | +30% sales, -50% returns |
| 4 | 35% increase in engagement with AR/AI virtual fitting | +35% engagement, -40% returns |
| 5 | 25% improvement in sales and 50% better customer retention | +25% sales, +50% retention |
| 6 | 10% increase in fitting room conversions, 25% jump in basket size | +10% conversions, +25% basket size |
| 7 | Shoppers using fitting rooms are 40% less likely to return items | -40% returns |
| 8 | 20% of fitting room visits generate over 45% of store revenue | 20% traffic → 45% revenue |
| 9 | Global VFR market to reach USD 20.29B by 2030 | ~19.8% CAGR (2025–2030) |
| 10 | VFR market valued at USD 5.57B in 2024 | Projected 24.6% CAGR to 2030 |
| 11 | Forecast: USD 6.86B in 2025 → USD 24.30B by 2032 | ~19.8% CAGR |
| 12 | Global market growth from USD 4.82B to USD 27.93B by 2032 | ~21.7% CAGR |
| 13 | North America holds ~39% of market share | APAC fastest-growing region |
| 14 | Software component accounts for ~48% of revenue | Dominates VFR market segments |
| 15 | Apparel segment largest VFR application share | Fashion leads adoption |
| 16 | Virtual stores show highest CAGR through 2030 | Strong e-commerce integration |
| 17 | 82% of visitors view products in 3D | 34% engage for over 30 seconds |
| 18 | 94% conversion lift from 3D configurators | Increases buyer confidence |
| 19 | 66% of shoppers feel 3D tools boost purchase confidence | Improved decision-making |
| 20 | VFR reduces fit-related returns by up to 50% | Higher satisfaction, lower costs |
Top 20 Virtual Model Conversion Lift Statistics 2025
Virtual Model Conversion Lift Statistics#1 – 34% Uplift in Conversion Rates from Virtual Fitting Room Usage
Retailers implementing virtual fitting rooms have reported a 34% increase in conversions. This lift comes from allowing customers to visualize fit and style before purchasing, reducing hesitation. By giving shoppers more confidence, the likelihood of cart abandonment drops significantly. Additionally, return rates have seen a 60% reduction, which translates into direct cost savings. For many brands, this technology is now seen as a competitive advantage in online retail.
Virtual Model Conversion Lift Statistics#2 – 25% Increase in Conversion Rates with AR Try-On
Augmented reality try-on tools have delivered a 25% boost in conversion rates for fashion retailers. Customers are more inclined to purchase when they can virtually “wear” products. This visual experience reduces uncertainty, especially for style and sizing. The technology also leads to a 40% drop in returns. Brands adopting AR try-ons are seeing a noticeable improvement in both sales and customer satisfaction.

Virtual Model Conversion Lift Statistics#3 – 30% Sales Growth after 6 Months of Virtual Try-On Integration
Within just six months of adopting virtual try-on systems, some retailers have seen a 30% surge in sales. This rapid growth stems from increased shopper engagement and trust in the purchase decision. The same period also recorded a 50% decrease in returns. These improvements directly impact profitability by lowering operational costs. The data shows that integrating virtual try-ons can quickly pay off for e-commerce businesses.
Virtual Model Conversion Lift Statistics#4 – 35% Increase in Engagement with AR/AI Virtual Fitting
AR and AI-powered fitting rooms have been linked to a 35% rise in online engagement. Shoppers spend more time interacting with products when they can see them in realistic 3D. This extended engagement often translates to higher conversion rates. Retailers also report a 40% reduction in return rates due to more accurate fit assessments. Enhanced engagement is proving to be a strong driver of long-term brand loyalty.
Virtual Model Conversion Lift Statistics#5 – 25% Improvement in Sales and 50% Better Customer Retention
Some boutiques using AR-based fitting rooms have reported a 25% jump in sales. The immersive experience makes customers more likely to purchase and return for future orders. Retention rates have improved by 50%, highlighting the long-term impact of the technology. These tools foster a sense of personalization and brand connection. Over time, this builds a loyal customer base with higher lifetime value.
Virtual Model Conversion Lift Statistics#6 – 10% Increase in Fitting Room Conversions, 25% Jump in Basket Size
Smart fitting room technology has increased conversion rates by 10% in physical retail settings. Shoppers using the tech are more likely to add additional items to their cart, leading to a 25% increase in basket size. This suggests that interactive fitting solutions not only help with purchase decisions but also encourage upselling. The convenience and novelty factor can enhance the overall shopping experience. For retailers, it’s a proven way to raise both sales volume and transaction value.
Virtual Model Conversion Lift Statistics#7 – Shoppers Using Fitting Rooms are 40% Less Likely to Return Items
Data shows that shoppers who use fitting rooms return 40% fewer products. Trying items virtually or physically reduces mismatches in size and style. This directly lowers reverse logistics costs for retailers. It also improves customer satisfaction, as buyers are happier with their purchases. For e-commerce stores, reducing returns is a major win for both profit margins and brand reputation.
Virtual Model Conversion Lift Statistics#8 – 20% of Fitting Room Visits Generate Over 45% of Store Revenue
A surprising 20% of customers who use fitting rooms contribute to nearly half of total store revenue. This shows the importance of providing engaging try-on experiences. Customers who interact with products more thoroughly are more likely to purchase multiple items. For physical and digital retail alike, enhancing the try-on process can have an outsized impact on sales. This statistic makes a strong case for investing in virtual model technologies.

Virtual Model Conversion Lift Statistics#9 – Global VFR Market to Reach USD 20.29B by 2030
The global virtual fitting room market is projected to hit $20.29 billion by 2030. This growth is driven by rising adoption across fashion, eyewear, and accessories. The market is expanding at a compound annual growth rate (CAGR) of nearly 20%. As consumer expectations shift toward interactive and personalized shopping, this segment is expected to dominate retail tech investments. Retailers that adopt early may gain a significant competitive edge.
Virtual Model Conversion Lift Statistics#10 – VFR Market Valued at USD 5.57B in 2024
In 2024, the virtual fitting room market stood at $5.57 billion. It’s projected to grow rapidly over the next five years. This value reflects both increasing retailer adoption and consumer demand for immersive shopping experiences. The CAGR of 24.6% to 2030 highlights its high-growth potential. It’s clear that virtual try-on technology is moving from novelty to mainstream.
Virtual Model Conversion Lift Statistics#11 – USD 6.86B in 2025 → USD 24.30B by 2032
By 2025, the virtual fitting room market will be worth an estimated $6.86 billion. Analysts forecast this figure will rise to $24.30 billion by 2032. This trend shows the sector’s long-term growth potential. A CAGR of 19.8% suggests consistent expansion across multiple retail categories. The sustained growth is tied to advancements in AI, AR, and computer vision.
Virtual Model Conversion Lift Statistics#12 – USD 4.82B to USD 27.93B by 2032
The global market will grow from $4.82 billion in 2023 to $27.93 billion in 2032. This is an impressive CAGR of 21.7% over the period. Such figures point to increasing consumer reliance on digital try-on solutions. The expansion also suggests wider adoption beyond fashion, into cosmetics and home décor. As technology becomes more accessible, smaller brands will join the trend.
Virtual Model Conversion Lift Statistics#13 – North America Holds ~39% Market Share
North America currently leads the global virtual fitting room market with 39% share. The region’s dominance is fueled by high e-commerce penetration and early adoption of retail tech. However, Asia-Pacific is catching up fast. This dynamic signals future competition between regions in terms of innovation and deployment. For now, U.S. and Canadian retailers enjoy a first-mover advantage.
Virtual Model Conversion Lift Statistics#14 – Software Component Accounts for ~48% of Revenue
Nearly half of the virtual fitting room market’s revenue comes from software solutions. This includes AR applications, 3D modeling systems, and AI-based size recommendations. The software’s scalability makes it more profitable than hardware-dependent options. As cloud-based solutions become more advanced, this share is likely to grow. Retailers benefit from faster deployment and easier integration.

Virtual Model Conversion Lift Statistics#15 – Apparel Segment Largest VFR Application Share
Apparel dominates the virtual fitting room market in terms of application share. Clothing retailers benefit the most from helping customers visualize fit before purchase. This reduces returns, increases sales, and strengthens brand loyalty. Other sectors like eyewear and footwear are growing but remain smaller. Apparel is expected to lead VFR adoption for the foreseeable future.
Virtual Model Conversion Lift Statistics#16 – Virtual Stores Show Highest CAGR Through 2030
E-commerce platforms with virtual store features are projected to have the highest growth rate in the VFR market. These platforms offer complete shopping experiences, from browsing to virtual try-ons. The convenience and engagement they provide are unmatched by traditional online shopping. This trend is fueled by both technological advancements and changing consumer habits. Retailers who innovate in this space are set to capture more market share.
Virtual Model Conversion Lift Statistics#17 – 82% of Visitors View Products in 3D
An overwhelming 82% of online shoppers engage with 3D product views when available. This suggests a strong preference for interactive visuals over static images. About 34% of these visitors interact with the 3D view for more than 30 seconds. This deeper engagement increases purchase likelihood. Retailers offering 3D experiences are better positioned to convert hesitant shoppers.
Virtual Model Conversion Lift Statistics#18 – 94% Conversion Lift from 3D Configurators
Retailers using 3D configurators have seen conversion lifts of up to 94%. This technology allows shoppers to customize products and view them in detail before buying. The ability to personalize and visualize items builds emotional investment in the purchase. As a result, customers are more likely to commit. This feature is becoming a key differentiator in competitive e-commerce markets.
Virtual Model Conversion Lift Statistics#19 – 66% of Shoppers Feel 3D Tools Boost Purchase Confidence
Two-thirds of shoppers say that 3D shopping tools increase their confidence in buying decisions. This reassurance is especially important for higher-priced items. By reducing uncertainty, 3D tools help overcome buying hesitations. They also enhance brand trust and customer loyalty. For many consumers, the presence of 3D features is now an expectation, not a bonus.
Virtual Model Conversion Lift Statistics#20 – VFR Reduces Fit-Related Returns by up to 50%
Virtual fitting rooms can cut fit-related returns in half. By showing customers how items will look and fit, they help avoid mismatches. This saves retailers significant costs in reverse logistics. It also improves sustainability by reducing waste from returned products. Lower return rates contribute to healthier profit margins and happier customers.

The Last Word on Virtual Model Conversion Lift
The data makes one thing clear — virtual try-on technology isn’t just a nice feature; it’s becoming a core part of how fashion e-commerce works. From boosting conversions to cutting returns in half, these tools are reshaping the online shopping experience for both brands and customers. Just like that perfect pair of socks you never want to take off, the right virtual model feature can be something shoppers come back for time and again. As adoption grows, we’ll likely see even more impressive numbers in the years ahead. If there’s ever been a time to embrace this tech, it’s now — the stats speak for themselves.
SOURCES
-
https://www.meegle.com/en_us/topics/o2o/virtual-fitting-rooms
-
https://www.mordorintelligence.com/industry-reports/virtual-fitting-room-market
-
https://www.fortunebusinessinsights.com/industry-reports/virtual-fitting-room-vfr-market-100322
-
https://www.fortunebusinessinsights.com/industry-reports/virtual-fitting-room-vfr-market-100322
-
https://www.fortunebusinessinsights.com/industry-reports/virtual-fitting-room-vfr-market-100322
-
https://www.mordorintelligence.com/industry-reports/virtual-fitting-room-market
-
https://www.fortunebusinessinsights.com/industry-reports/virtual-fitting-room-vfr-market-100322
-
https://www.mordorintelligence.com/industry-reports/virtual-fitting-room-market
-
https://patentpc.com/blog/ar-shopping-stats-try-before-you-buy-engagement-trends
-
https://patentpc.com/blog/ar-shopping-stats-try-before-you-buy-engagement-trends
-
https://www.mordorintelligence.com/industry-reports/virtual-fitting-room-market


