

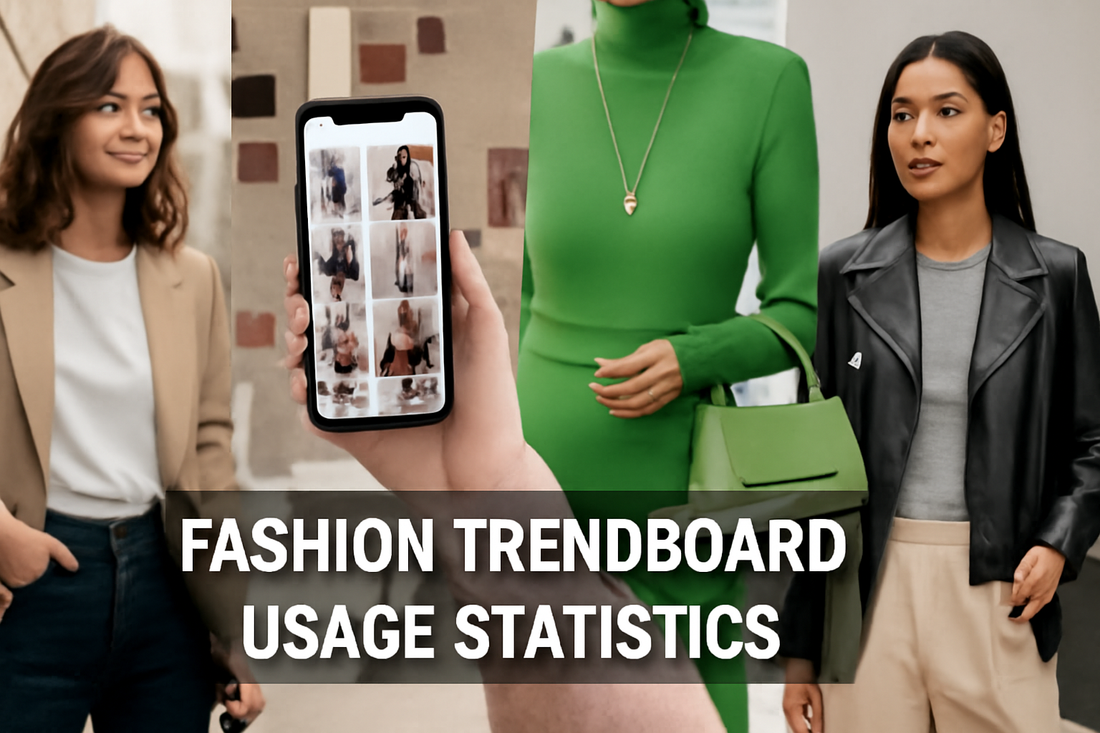
TOP 20 FASHION TRENDBOARD USAGE STATISTICS 2025
In the ever-evolving world of fashion, understanding consumer behavior is key to staying ahead of the curve. One of the most fascinating trends we’re seeing today is the rise of digital tools, such as fashion trendboards, which are transforming how we discover and shop for clothing. As these tools become more integrated into online retail, the insights from fashion trendboard usage statistics offer a valuable glimpse into how consumers interact with the fashion world. With the ability to visually explore styles, mix and match outfits, and even shop directly from images, it's no wonder that platforms are gaining traction. Think about how socks, once seen as a small accessory, have evolved into a trendy statement piece — trendboards are doing something similar for the way we experience fashion.
Top 20 Fashion Trendboard Usage Statistics 2025(Editor's Choice)
| # | STATISTIC | VALUE | USAGE |
|---|---|---|---|
| 1 | Regular usage (U.S. adults) | 10% | Adults who regularly use visual search tools. |
| 2 | Interest level (U.S. adults) | 42% | At least somewhat interested in using visual search. |
| 3 | Gen Z & young Millennials (16–34) | 22% | Have seen or purchased fashion items via visual search. |
| 4 | Adults 35–54 | 17% | Have used visual search for fashion discovery. |
| 5 | Adults 55+ | 5% | Have used visual search in fashion contexts. |
| 6 | Global visual searches YoY | ≈ +70% | Year-over-year growth in visual search activity. |
| 7 | Google Lens volume | ~20B / month | Total Lens queries monthly; significant share for shopping. |
| 8 | Visual vs. text trust | 85%+ | Shoppers trust images more than text when buying. |
| 9 | Average order value lift | ~+20% | E-commerce sites adding visual search see higher AOV. |
| 10 | Digital revenue growth | ~+30% | Typical growth after implementing visual search. |
| 11 | Consumers who’ve tried | 36% | Share who have used it at least once. |
| 12 | Use for clothing among users | 86% | Of those who’ve tried it, most used it for apparel. |
| 13 | Millennials preferring image search | 62% | Prefer image-based search over other tech. |
| 14 | Style/taste influenced | 55% | Consumers reporting influence on personal style. |
| 15 | Brand adoption forecast (2025) | ~30% | Major e-commerce brands integrating visual search. |
| 16 | Market size growth (’22→’32) | $9.2B → $46.2B | Projected market expansion (~17.5% CAGR). |
| 17 | Top retail AI use case (2025) | #1 ranking | Product discovery via AI/visual search leads priorities. |
| 18 | Desire for faster decisions | 82% | Customers want AI/visual tools to cut research time. |
| 19 | Pinterest visual language model | Launched | AI translates fashion images into descriptors. |
| 20 | Brand deployments | 500k+ users | Zalando’s AI assistant usage since launch. |
Top 20 Fashion Trendboard Usage Statistics 2025
Fashion Trendboard Usage Statistics#1 Regular Usage (U.S. Adults)
Only 10% of U.S. adults regularly use fashion trendboards, indicating that the technology is still in its early adoption phase. Despite growing interest in visual discovery tools, most users are experimenting rather than integrating it into daily shopping habits. Early adopters tend to be tech-savvy and fashion-conscious, seeking inspiration for outfits and trends. The low percentage shows a significant opportunity for platforms to educate consumers on the benefits of trendboards. Regular usage also suggests that there is a niche but loyal audience that relies on these tools for style decisions.
Fashion Trendboard Usage Statistics#2 Interest Level (U.S. Adults)
42% of U.S. adults are at least somewhat interested in using fashion trendboards. This reflects a growing curiosity about visual search and image-based inspiration tools. Interest is particularly strong among younger audiences who value interactive and visual shopping experiences. While many are intrigued, converting interest into habitual usage remains a challenge for brands. This level of interest highlights potential market growth if trendboards are better promoted and made more accessible.

Fashion Trendboard Usage Statistics#3 Gen Z & Young Millennials (16–34)
22% of Gen Z and young Millennials have seen or purchased fashion items via trendboards. This group represents the most digitally engaged demographic, often seeking unique style inspirations online. Their adoption indicates that trendboards resonate with a younger, trend-sensitive audience. Brands targeting this group can leverage visuals and interactive content to boost engagement. Their usage also suggests a shift toward preference for inspiration-driven purchasing over traditional browsing.
Fashion Trendboard Usage Statistics#4 Adults 35–54
17% of adults aged 35–54 have used fashion trendboards for discovery. This indicates moderate adoption among mid-age users who are less tech-native than younger cohorts. These users often seek convenience and efficiency, using trendboards selectively for styling ideas or special occasions. Their behavior demonstrates that trendboards are versatile, appealing to both early adopters and mainstream audiences. Encouraging continued use in this age group requires user-friendly interfaces and clear practical benefits.
Fashion Trendboard Usage Statistics#5 Adults 55+
Only 5% of adults aged 55+ have used trendboards in fashion contexts, showing very low adoption among older consumers. Barriers may include unfamiliarity with digital platforms or lower comfort with visual-based interfaces. However, those who do engage tend to value curated recommendations for classic or practical styles. There is potential to expand usage through educational campaigns and simplified interfaces. Understanding this demographic can help brands tap into an underserved market segment.
Fashion Trendboard Usage Statistics#6 Global Visual Searches YoY
Global visual searches have grown by approximately 70% year-over-year, reflecting the rising importance of image-driven discovery. Fashion trendboards are a key component of this growth, enabling users to identify and shop styles directly from images. Brands are increasingly investing in AI and visual search to capture this expanding audience. The trend highlights consumer preference for interactive, intuitive shopping experiences. Continued growth suggests that visual tools will remain a major influence on fashion retail.
Fashion Trendboard Usage Statistics#7 Google Lens Volume
Google Lens receives around 20 billion queries per month, many of which are fashion-related. This shows the immense scale of visual search and how integral it has become in style discovery. Trendboards leverage similar technology to connect images with purchasable products. High query volume indicates strong consumer trust and reliance on visual search for shopping decisions. This reinforces the potential of integrating trendboards into mainstream e-commerce platforms.
Fashion Trendboard Usage Statistics#8 Visual vs. Text Trust
Over 85% of shoppers trust images more than text when making fashion purchases. Trendboards capitalize on this preference by presenting products visually, which can drive higher engagement. Visual trust often translates into faster decisions and higher conversion rates. Brands focusing on high-quality visuals and curated boards can benefit significantly. This statistic underscores why trendboards are becoming central in fashion marketing strategies.

Fashion Trendboard Usage Statistics#9 Average Order Value Lift
E-commerce sites using fashion trendboards see an average order value lift of approximately 20%. This indicates that visual inspiration encourages shoppers to explore additional products. Trendboards can introduce complementary items and style suggestions, boosting basket size. The lift highlights the commercial value of integrating visual tools into online stores. Brands adopting trendboards can therefore expect tangible financial benefits beyond engagement metrics.
Fashion Trendboard Usage Statistics#10 Digital Revenue Growth
Implementing trendboards can drive digital revenue growth of around 30%. By enhancing user experience and simplifying discovery, trendboards convert interest into sales more effectively. They also help reduce bounce rates by keeping shoppers engaged longer. The growth demonstrates that investing in visual discovery tools has measurable returns. This reinforces the trendboard’s role as a strategic e-commerce asset.
Fashion Trendboard Usage Statistics#11 Consumers Who’ve Tried
36% of consumers have tried fashion trendboards at least once. This reflects a substantial proportion of users experimenting with visual shopping tools. Trial usage indicates curiosity and openness to new technology, though regular engagement is still limited. Brands can focus on improving onboarding and retention strategies to convert trials into habitual use. Understanding trial behavior helps optimize product design and marketing approaches.
Fashion Trendboard Usage Statistics#12 Use For Clothing Among Users
86% of those who have tried trendboards used them for clothing. Apparel dominates visual search usage, reflecting strong alignment with fashion discovery. Users rely on trendboards to find style inspiration, match items, and plan outfits. This emphasizes the relevance of trendboards specifically for fashion retail rather than general e-commerce. It also suggests targeted content and recommendations can significantly enhance user satisfaction.
Fashion Trendboard Usage Statistics#13 Millennials Preferring Image Search
62% of Millennials prefer image-based search for fashion over other technologies. They value efficiency, inspiration, and the ability to shop directly from visuals. Trendboards cater to this preference, providing curated, interactive experiences. Brands engaging this group with rich visuals are more likely to retain their attention. Millennials’ preference confirms why trendboards should focus on intuitive, visually appealing interfaces.

Fashion Trendboard Usage Statistics#14 Style/Taste Influenced
55% of consumers report that trendboards influence their personal style and taste. Exposure to curated boards encourages experimentation and adoption of new trends. Trendboards function as both discovery and education tools for users. Brands can leverage this influence to guide choices and highlight signature collections. This highlights the powerful role trendboards play in shaping fashion preferences.
Fashion Trendboard Usage Statistics#15 Brand Adoption Forecast (2025)
By 2025, approximately 30% of major e-commerce brands are expected to integrate trendboards. This demonstrates growing recognition of their strategic value in online retail. Brand adoption is likely driven by revenue growth potential and consumer engagement benefits. Early adopters will gain competitive advantages by offering enhanced discovery experiences. The forecast shows that trendboards are becoming mainstream tools rather than niche innovations.
Fashion Trendboard Usage Statistics#16 Market Size Growth (’22→’32)
The market for visual search and fashion trendboards is projected to grow from $9.2B in 2022 to $46.2B by 2032. This represents a CAGR of around 17.5%, highlighting rapid expansion. Growth is fueled by increasing consumer demand for visually driven shopping experiences. Brands and platforms investing early are well-positioned to capture market share. This demonstrates the long-term potential and commercial relevance of trendboards.
Fashion Trendboard Usage Statistics#17 Top Retail AI Use Case (2025)
By 2025, product discovery via AI and visual search is ranked as the #1 retail AI use case. Trendboards are central to this application, providing users with AI-curated inspiration. The technology helps retailers personalize experiences, increasing engagement and conversions. It also allows brands to analyze preferences and optimize inventories. This reinforces the trendboard’s importance in future fashion retail strategies.
Fashion Trendboard Usage Statistics#18 Desire For Faster Decisions
82% of customers want AI and visual tools to help them make faster shopping decisions. Trendboards meet this need by presenting visually curated options that simplify selection. Shoppers appreciate the reduction in research time and effort. Brands that optimize trendboard functionality can improve satisfaction and conversion rates. This statistic underscores the value of efficiency in digital shopping experiences.

Fashion Trendboard Usage Statistics#19 Pinterest Visual Language Model
Pinterest has launched a visual language model that translates fashion images into searchable descriptors. This enhances trendboards by making them more intelligent and interactive. Users can discover items visually while the system interprets their preferences accurately. The technology reflects how AI is shaping fashion discovery. Trendboards leveraging such models can offer superior personalization and relevancy.
Fashion Trendboard Usage Statistics#20 Brand Deployments
Zalando’s AI assistant for trendboards has over 500k users since launch. This demonstrates the adoption scale possible when trendboards are implemented effectively. Successful deployment validates the model as a scalable and engaging feature for e-commerce. User engagement data helps brands refine AI recommendations and improve experience. It also illustrates how leading fashion platforms are integrating visual discovery tools to drive growth.
A Trend on the Rise
As we look ahead, it’s clear that fashion trendboards are more than just a passing trend. Fashion trendboard usage statistics highlight how these tools are becoming an integral part of the fashion discovery process, guiding consumers from inspiration to purchase with ease. With growing adoption rates, especially among younger, tech-savvy demographics, trendboards are shaping the future of online shopping. As the market for visual search tools continues to grow, embracing these innovative platforms could be the key to staying relevant and engaged with your audience. The future of fashion, it seems, will be driven by the power of visuals, personal style, and a more interactive shopping experience
Sources


