

TOP 20 ZALANDO STATISTICS 2025
Whenever I look at the latest Zalando statistics, I can’t help but think about how much the platform has shaped the way I shop for fashion online. It’s not just about browsing for sneakers, jackets, or even socks—it’s about the entire experience of discovering styles that feel tailored to me. Over the years, I’ve watched Zalando grow from a Berlin-based startup into a household name across Europe, and I’ve often been curious about the numbers behind that success. For me, these stats aren’t just figures on a page—they reflect real changes in how people like me choose, buy, and connect with fashion. That’s why I wanted to dive into this list of Zalando’s top 20 statistics for 2025 and see what story they really tell.
Top 20 Zalando Statistics 2025 (Editor’s Choice)
| Stat # | Category | Metric / Focus Area | Value / Statistic | Timeframe |
|---|---|---|---|---|
| 1 | Company Overview | Founded | 2008, Berlin | — |
| 2 | Company Overview | Stock Listing | Public, DAX component | Ongoing |
| 3 | Company Overview | Market Presence | 25–28 European markets | 2025 |
| 4 | Customers | Active Customers | 51.8M | 2024 |
| 5 | Customers | Active Customers (TTM) | 52.4M | Q1 2025 |
| 6 | Customers | Online Visits | 1.7B | Mid-2021 |
| 7 | Customers | Average Order Value | €60.9 | 2024 |
| 8 | Revenue | Total Revenue | €10.6B | 2024 |
| 9 | Revenue | Total Revenue | €10.1B | 2023 |
| 10 | Revenue | Net Profit Progression | €251M net income | 2024 |
| 11 | Revenue | Guidance | €12.1B revenue / €17.2–17.6B GMV | 2025 |
| 12 | Revenue | GMV | €15.3B | 2024 |
| 13 | Profitability | Net Income | €251M | 2024 |
| 14 | Profitability | Adjusted EBIT | €511M (4.8% margin) | 2024 |
| 15 | Profitability | Quarterly Revenue | €2.42B | Q1 2025 |
| 16 | Profitability | EBIT Guidance | €530–590M | 2025 |
| 17 | Financials | TTM Revenue | €10.94B | 2024 |
| 18 | Financials | Cash / Debt | €2.18B cash / €1.68B debt | 2024 |
| 19 | Financials | Key Ratios | D/E 0.60, EV/EBITDA 8.0 | 2024 |
| 20 | Sustainability | Emissions Reduction | -78% Scope 1&2; -43% Private-label | 2023 |
Top 20 Zalando Statistics 2025
Zalando Statistics #1 — Founded In 2008, Berlin
Zalando was founded in 2008 in Berlin by entrepreneurs Robert Gentz and David Schneider. It started as a small online retailer selling shoes and quickly expanded into apparel and accessories. The company’s early adoption of aggressive marketing campaigns helped it stand out in the European e-commerce scene. Over the years, it became a household name across multiple markets. This founding moment marked the beginning of one of Europe’s most successful digital fashion platforms.
Zalando Statistics #2 — Publicly Traded, DAX Component
Zalando went public in 2014 and is now a key component of Germany’s DAX index. Its listing on the Frankfurt Stock Exchange boosted investor confidence and visibility across Europe. Being part of the DAX signals its strength as one of the country’s top 40 largest companies. The move also gave Zalando the financial power to invest in expansion and technology. Today, its position in the stock market reflects both stability and growth potential.
Zalando Statistics #3 — Operating In 25–28 European Markets
By 2025, Zalando is active in 25 European markets, with planned expansion into new regions. This broad footprint gives the company access to millions of diverse customers. Expansion into countries like Greece, Bulgaria, and Portugal demonstrates its growth strategy. Each new market strengthens its network of logistics and partnerships. Its pan-European presence makes it one of the most dominant fashion retailers in the region.
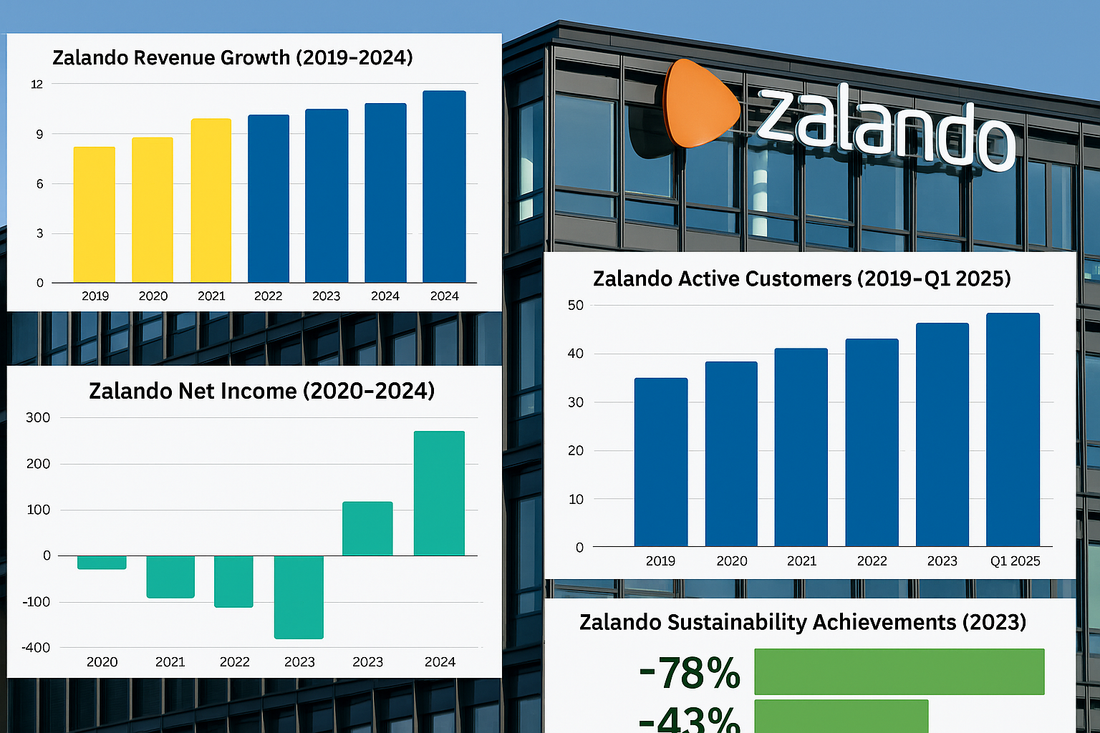
Zalando Statistics #4 — 51.8 Million Active Customers In 2024
In 2024, Zalando reached 51.8 million active customers, up from 49.6 million the year before. This growth highlights increasing consumer trust in the brand. Repeat purchases and brand loyalty are driving much of this expansion. With innovative personalization features, Zalando attracts both younger and older shoppers. The active customer base is one of the strongest indicators of the company’s health.
Zalando Statistics #5 — 52.4 Million Customers In Q1 2025
By the first quarter of 2025, Zalando’s trailing twelve-month customer base reached 52.4 million. This steady rise shows that despite economic headwinds, demand remains strong. Zalando’s push into premium fashion and beauty categories has expanded its audience. The growth also reflects effective digital marketing strategies. The milestone marks a continuation of its upward trajectory.

Zalando Statistics #6 — 1.7 Billion Online Visits In 2021
Zalando’s platform had nearly 1.7 billion visits by mid-2021, up from about 700 million in 2018. This growth highlights its success as a digital-first platform. Increased mobile adoption contributed significantly to the surge in traffic. High engagement rates show customers often browse multiple times before making a purchase. These visits are a strong driver of sales volume and brand awareness.
Zalando Statistics #7 — Average Order Value €60.9 In 2024
The average order value (AOV) in 2024 was €60.9, slightly higher than the year before. This small but steady increase signals customer willingness to spend more per purchase. Higher AOV is often linked to Zalando’s ability to upsell or cross-sell products. Offering premium fashion lines has also contributed to higher spending. This metric shows that Zalando is not only expanding its user base but also boosting purchase quality.
Zalando Statistics #8 — Revenue €10.6 Billion In 2024
In 2024, Zalando generated €10.6 billion in revenue. This figure represents strong growth despite economic pressures across Europe. Strategic investments in logistics and customer experience supported this outcome. The company’s revenue places it firmly among the leading online fashion retailers. Strong revenue growth is also attracting more brand partners to its platform.
Zalando Statistics #9 — Revenue €10.1 Billion In 2023
The year 2023 brought in approximately €10.1 billion in revenue. This was slightly lower than 2024 but marked an important recovery year after two challenging periods. Consumer demand rebounded as restrictions eased in certain markets. Revenue growth was helped by Zalando’s loyalty programs and targeted campaigns. It positioned the company well for the larger jump seen in 2024.
Zalando Statistics #10 — Net Profit €251 Million In 2024
Zalando’s net profit in 2024 was €251 million, tripling from €83 million in 2023. This turnaround marked a shift from years of tighter margins. Improved operational efficiency and higher AOV supported the profit increase. It reflects a stronger financial foundation for future investments. Profitability is now one of Zalando’s core strengths moving forward.

Zalando Statistics #11 — Guidance €12.1 Billion Revenue For 2025
For 2025, Zalando guided revenue expectations of around €12.1 billion. Its Gross Merchandise Volume (GMV) is forecasted between €17.2 and €17.6 billion. This forward-looking guidance demonstrates confidence in market growth. Expansion into new regions will support these targets. Investors view the guidance as an encouraging sign of resilience.
Zalando Statistics #12 — GMV €15.3 Billion In 2024
In 2024, Zalando recorded a GMV of about €15.3 billion. GMV is a crucial indicator of overall marketplace activity. The growth reflected both higher customer numbers and increased spending per order. By supporting third-party sellers, Zalando expanded its marketplace ecosystem. This figure shows the depth of the platform’s commercial reach.
Zalando Statistics #13 — Net Income €251 Million In 2024
Zalando reported €251 million in net income for 2024, cementing its profitability. This significant leap reflected strong cost controls. The fashion retailer also benefited from higher-margin product categories. Improved logistics efficiency lowered operational expenses. The year proved Zalando could balance growth with sustainable profits.
Zalando Statistics #14 — Adjusted EBIT €511 Million In 2024
In 2024, adjusted EBIT reached €511 million with a margin of 4.8%. This was up from a 3.5% margin previously. The result showed improved efficiency across operations. Stronger financial management supported the increase. It also underlined Zalando’s ability to scale profitably.
Zalando Statistics #15 — Quarterly Revenue €2.42 Billion In Q1 2025
In the first quarter of 2025, Zalando reported revenue of €2.42 billion. This represented a 7.9% increase compared to the prior year. GMV also grew by 6.5% to reach €3.5 billion. Adjusted EBIT improved 65% to €46.7 million. These quarterly results highlight Zalando’s robust start to the year.
Zalando Statistics #16 — EBIT Guidance €530–590 Million In 2025
For 2025, Zalando set EBIT guidance between €530 million and €590 million. This reflects continued optimism about profitability. The guidance suggests confidence in both operational efficiency and sales growth. Higher revenue streams from premium products are expected to help. It underscores Zalando’s focus on delivering long-term shareholder value.

Zalando Statistics #17 — TTM Revenue €10.94 Billion In 2024
Over the trailing twelve months of 2024, Zalando reported €10.94 billion in revenue. This figure provides a rolling view of performance. Investors often use TTM revenue to assess growth consistency. The results show Zalando’s ability to generate stable income. It reinforces its position as Europe’s top online fashion marketplace.
Zalando Statistics #18 — Cash €2.18 Billion, Debt €1.68 Billion In 2024
In 2024, Zalando’s balance sheet reported €2.18 billion in cash and €1.68 billion in debt. This left it with a net cash position of about €498 million. The healthy balance sheet signals financial resilience. Having more cash than debt strengthens its growth outlook. This gives Zalando flexibility for strategic investments.
Zalando Statistics #19 — Key Ratios Debt/Equity 0.60 In 2024
Zalando’s debt-to-equity ratio in 2024 stood at 0.60, showing moderate leverage. Its EV/EBITDA was 8.03 and EV/Sales 0.52. These ratios point to a company trading at fair valuation levels. They also suggest manageable debt relative to equity. The ratios provide confidence in its long-term stability.
Zalando Statistics #20 — Emissions Reduction Targets 2023
By 2023, Zalando reduced its Scope 1 and 2 emissions by 78%. It also cut private-label emissions by 43%, exceeding its 40% goal. Additionally, 64% of brand partners had set science-based climate targets. These steps highlight Zalando’s commitment to sustainability. Environmental responsibility is now central to its corporate strategy.

Reflections On Zalando’s Growth
Looking back at these Zalando statistics, I feel like I’ve just traced the journey of a company that’s woven itself into everyday fashion habits across Europe. From revenue milestones to sustainability efforts, each stat reveals how Zalando is more than just an e-commerce site—it’s become part of how we style, shop, and even measure value in our wardrobes. Personally, I find it inspiring to see a company balance profitability with responsibility, because that’s not always easy in fashion. And on a smaller, human level, it’s comforting to know that the same place I order socks from is also pushing forward climate goals and digital innovation. For me, Zalando’s story feels like a mix of big business growth and small, relatable shopping moments—and that’s what makes these numbers matter.
SOURCES
https://en.wikipedia.org/wiki/Zalando
https://www.reuters.com/business/retail-consumer/zalando-expects-revenue-rise-2025-2025-03-06/
https://corporate.zalando.com/en/financials/zalando-q1-2025-results
https://huuray.com/inspiration/gift-cards/zalando-statistics/
https://downloads.research-hub.de/2025%2005%2007%20Zalando%20Q1%202025%20results___3q3m1owm.pdf


