

TOP 20 LAYERED LOOK PLANNING APP USAGE STATISTICS 2025
28 Aug 2025
When I first started diving into layered outfits, I never thought I’d be tracking numbers, but here we are. The truth is, fashion and data have become inseparable, and that’s what makes these layered look planning app usage statistics so fascinating. They don’t just tell us how many people are tapping into digital styling—they reveal how we all juggle the daily decisions of what to wear, right down to whether a pair of socks completes the look. It feels personal because we’ve all been there: standing in front of the closet, overwhelmed, wishing for an easier way to piece things together. These stats capture that shared moment and show how technology is quietly reshaping the ritual of getting dressed.
Top 20 Layered Look Planning App Usage Statistics 2025 (Editor’s Choice)
| # | Statistic | Context | User Segment |
|---|---|---|---|
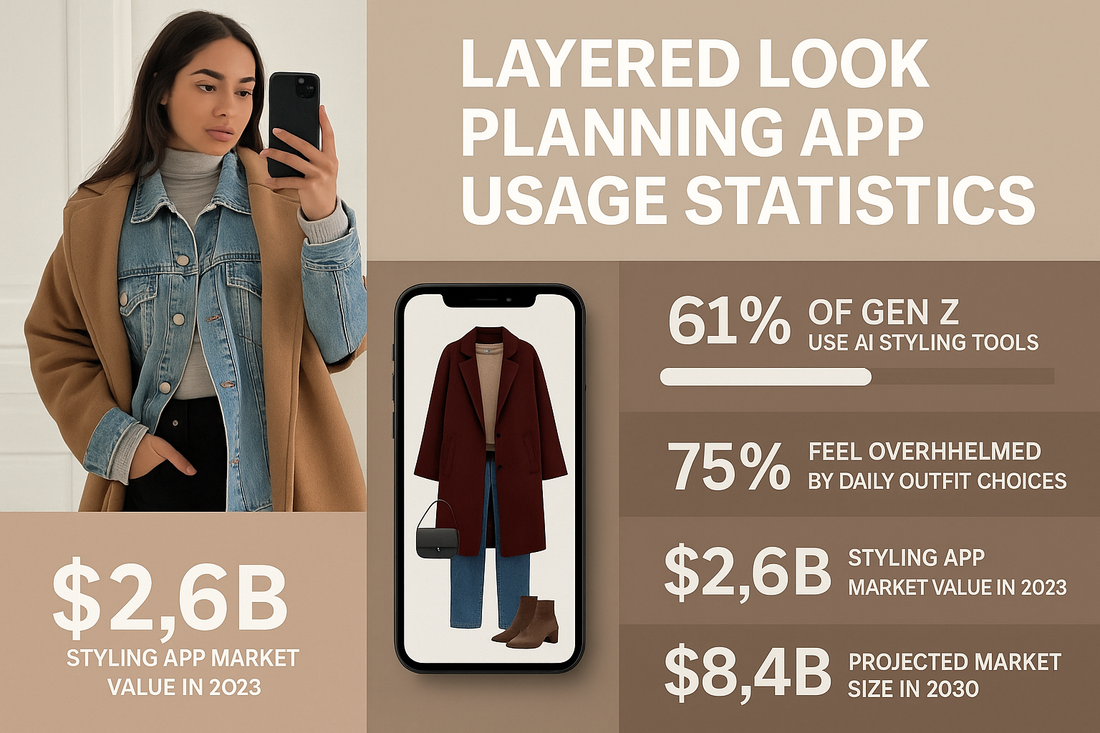
| 1 | 61% of Gen Z use AI styling tools | Shows high adoption of digital outfit planners in daily life | Gen Z |
| 2 | 400% increase in user retention with AI-generated looks (2022–24) | AI-driven styling tools boost long-term engagement | All digital fashion users |
| 3 | 75% feel overwhelmed by daily outfit choices | Decision fatigue drives adoption of layered look planning apps | General consumers |
| 4 | Whering reached ~2M users globally | Shows traction of dedicated wardrobe/planning apps | US & Latin America |
| 5 | 1,300% surge in uploads of red fashion items | Reflects app responsiveness to trend-driven outfit planning | Whering users |
| 6 | Gen Z use Apple Notes as makeshift outfit planners | DIY layered look planning with phone-native apps | Gen Z |
| 7 | Styling app market valued at $2.6B in 2023 | Overall industry scale shows rising usage demand | Global fashion tech users |
| 8 | Market projected to reach $8.4B by 2030 | 31% CAGR highlights future growth potential | Global market |
| 9 | 14–18 apps used weekly by typical users | Layered look planners must compete for daily engagement | Mobile app users |
| 10 | 85% of shoppers trust images over text | Visual outfit previews crucial for layered look apps | Online shoppers |
| 11 | +20% average order value lift with visual tools | Retailers integrating outfit planning see higher spending | E-commerce customers |
| 12 | 30% of brands expected to adopt visual search by 2025 | Signals broader adoption of digital styling solutions | Fashion retailers |
| 13 | 36% of consumers have tried visual-based discovery | Indicates growing familiarity with digital outfit planning | General consumers |
| 14 | 86% of visual search users focus on apparel | Fashion is the top category for layered look planning | Visual search adopters |
| 15 | 62% of Millennials prefer image-based search | Millennials value visuals for wardrobe and outfit planning | Millennials |
| 16 | 55% report style influenced by visual discovery | Layered look planners directly shape consumer taste | Fashion-conscious consumers |
| 17 | $9.2B → $46.2B projected market size (2022–2032) | Visual tech and outfit planning grow at ~17.5% CAGR | Global market |
| 18 | 82% want tools to speed up fashion decision-making | Efficiency is key driver of layered look app adoption | Online shoppers |
| 19 | Pinterest AI translates fashion images to text descriptors | Tech supports layering/combination outfit planning | Pinterest users |
| 20 | Zalando’s AI assistant surpassed 500k users | Early success of fashion AI tools for outfit planning | Zalando customers |
Top 20 Layered Look Planning App Usage Statistics 2025


